SoftwareReviews
Product Page Redesign
ROLE
Product Designer
TEAMS
FE devs, BE team, Marketing team
TIMELINE
6 months, 2022
TOOLS
Figma, Adobe
vendors reported satisfaction with the redesign
increase in scroll depth
TASK
This project focused on redesigning the product page system into a scalable, templated experience that could support all software offerings while improving decision confidence, content clarity, and long-term engagement.
MY ROLE
Led UX for one scalable template for every listing. Prioritized data visualization and reviews, and mapped every page scenario with engineering before building.

Context and Constraints
Based on the competitor analysis and the observations on the heatmaps, our product pages had three problems:
No structured evidence: Pages had little data-driven content, so buyers had nothing to scan and left.
Misleading visuals: Heatmaps showed most users assumed images were clickable, which created dead ends.
A distracting sidebar: Sidebar content interrupted reading and pulled attention from the product information.
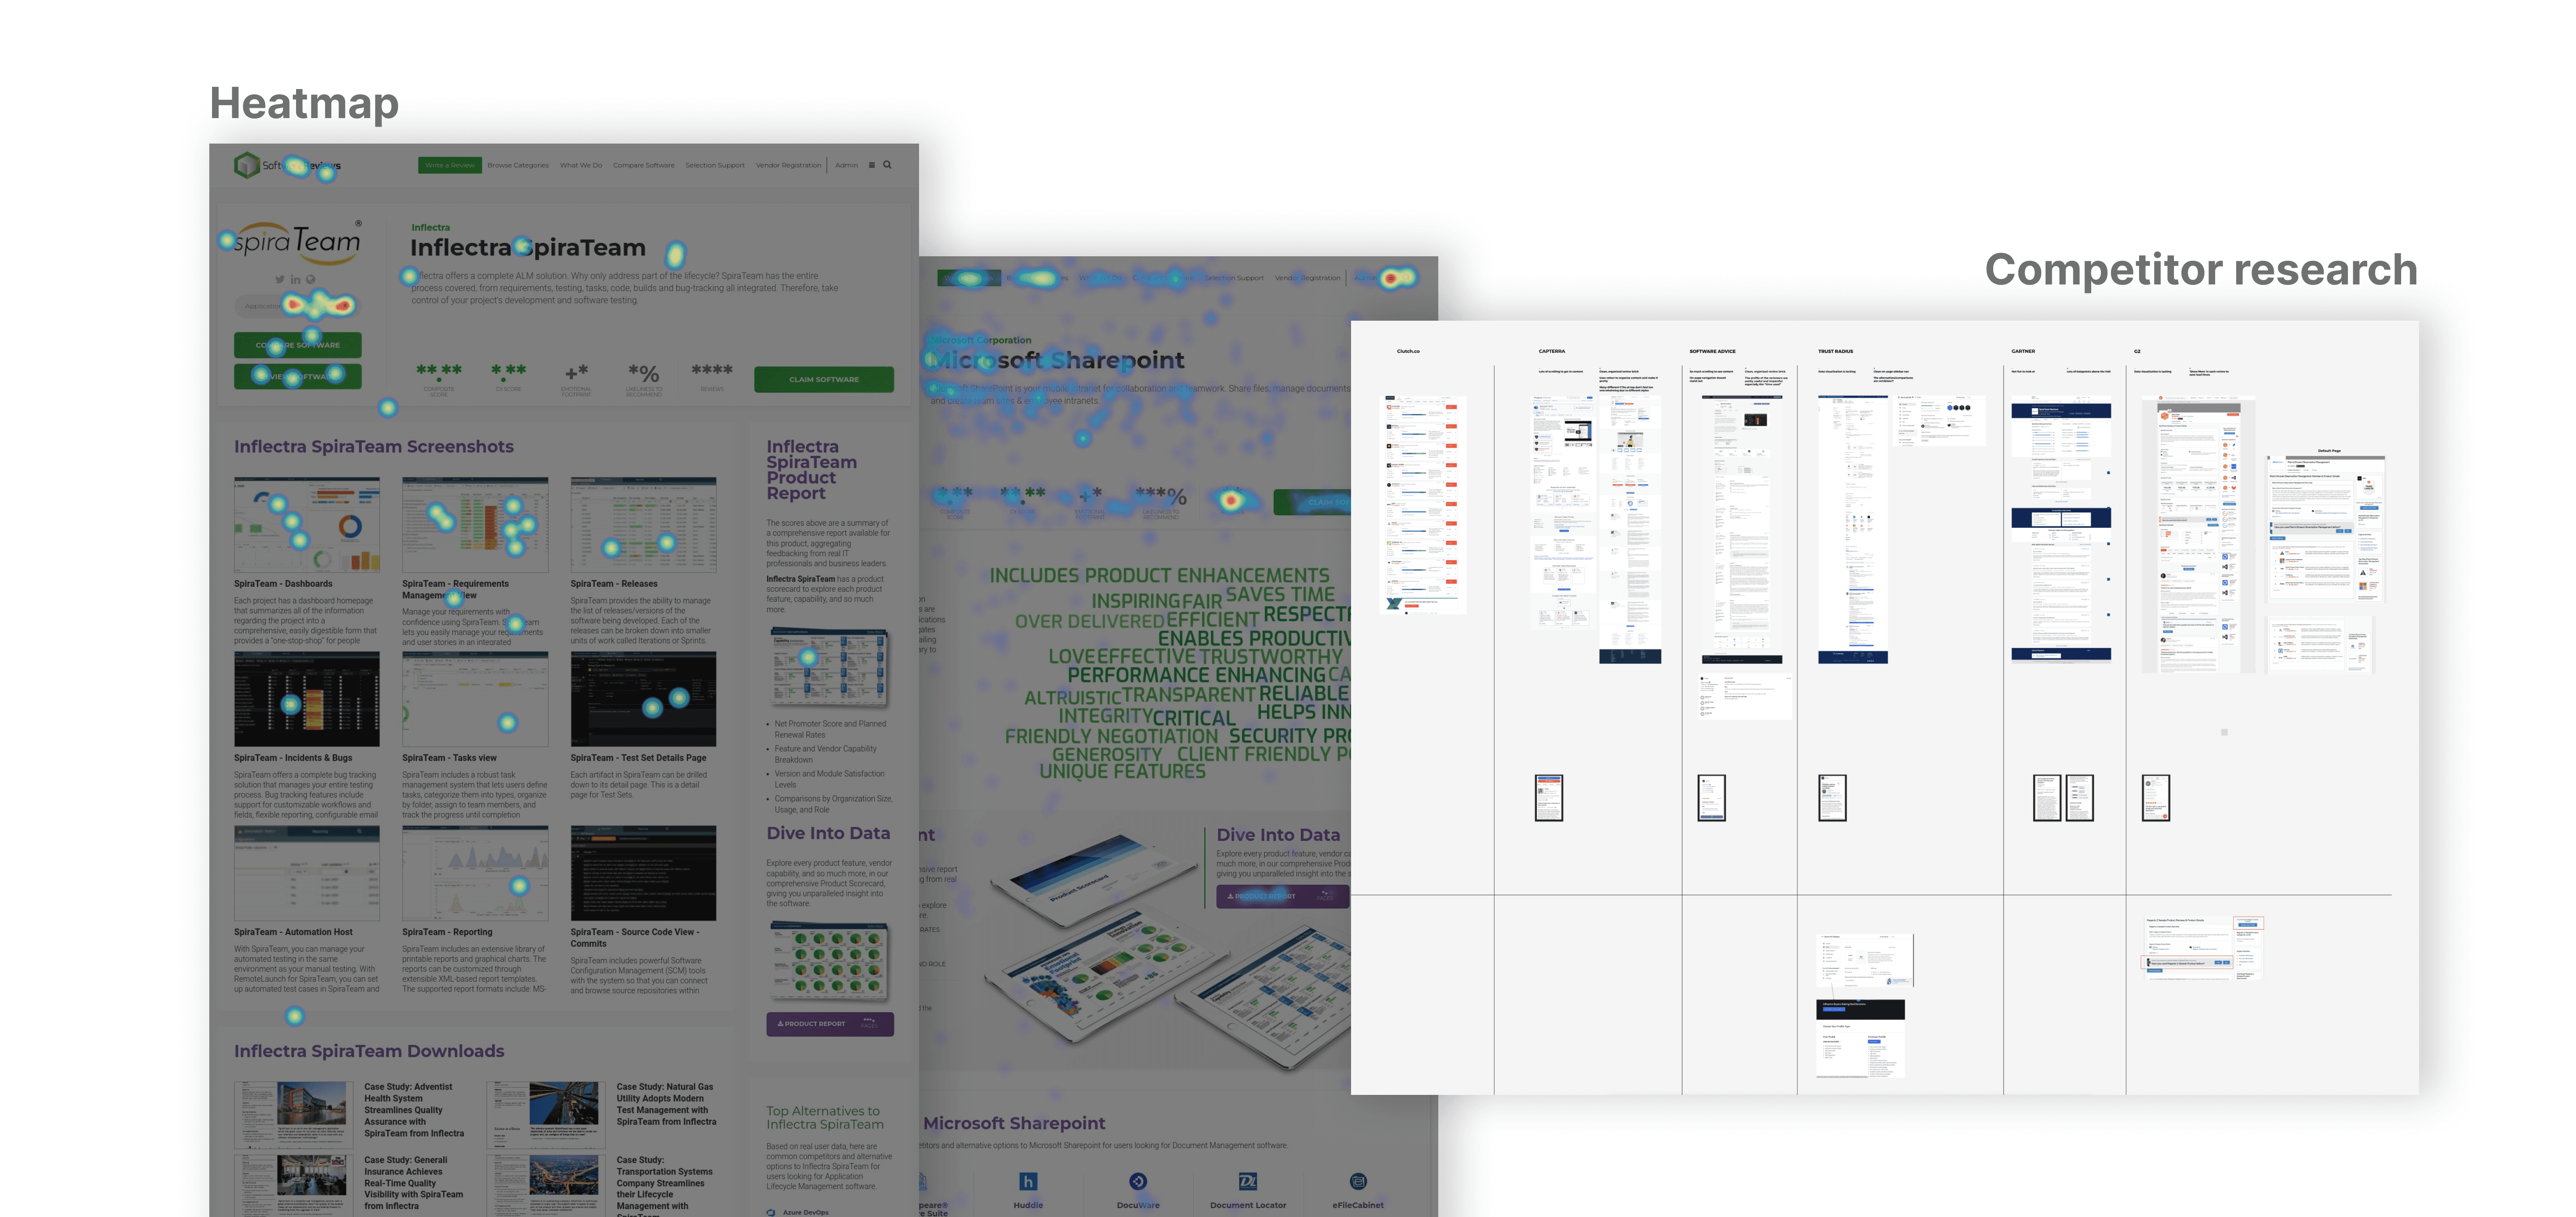
Due to the limited visibility in data, the product page needs a redesign to maximize value and utility of page for end-users.
Design Process
Stakeholder wireframe: Stakeholders shared a wireframe with the features they wanted to add and the order they expected: simplified header, all awards, data visualization and product reviews.
UX review: I compared the wire against our heatmaps and five competitors(Capterra, G2, Software Advice, Trust Radius and Gartner). With the findings gathered, I pointed out the pain points and provided the suggestions to optimize our product page.
Scenario mapping: I revised the wires to combine stakeholder requirements with the UX findings and mapped every state the template would face (rich, sparse or missing data) before any high-fidelity work.
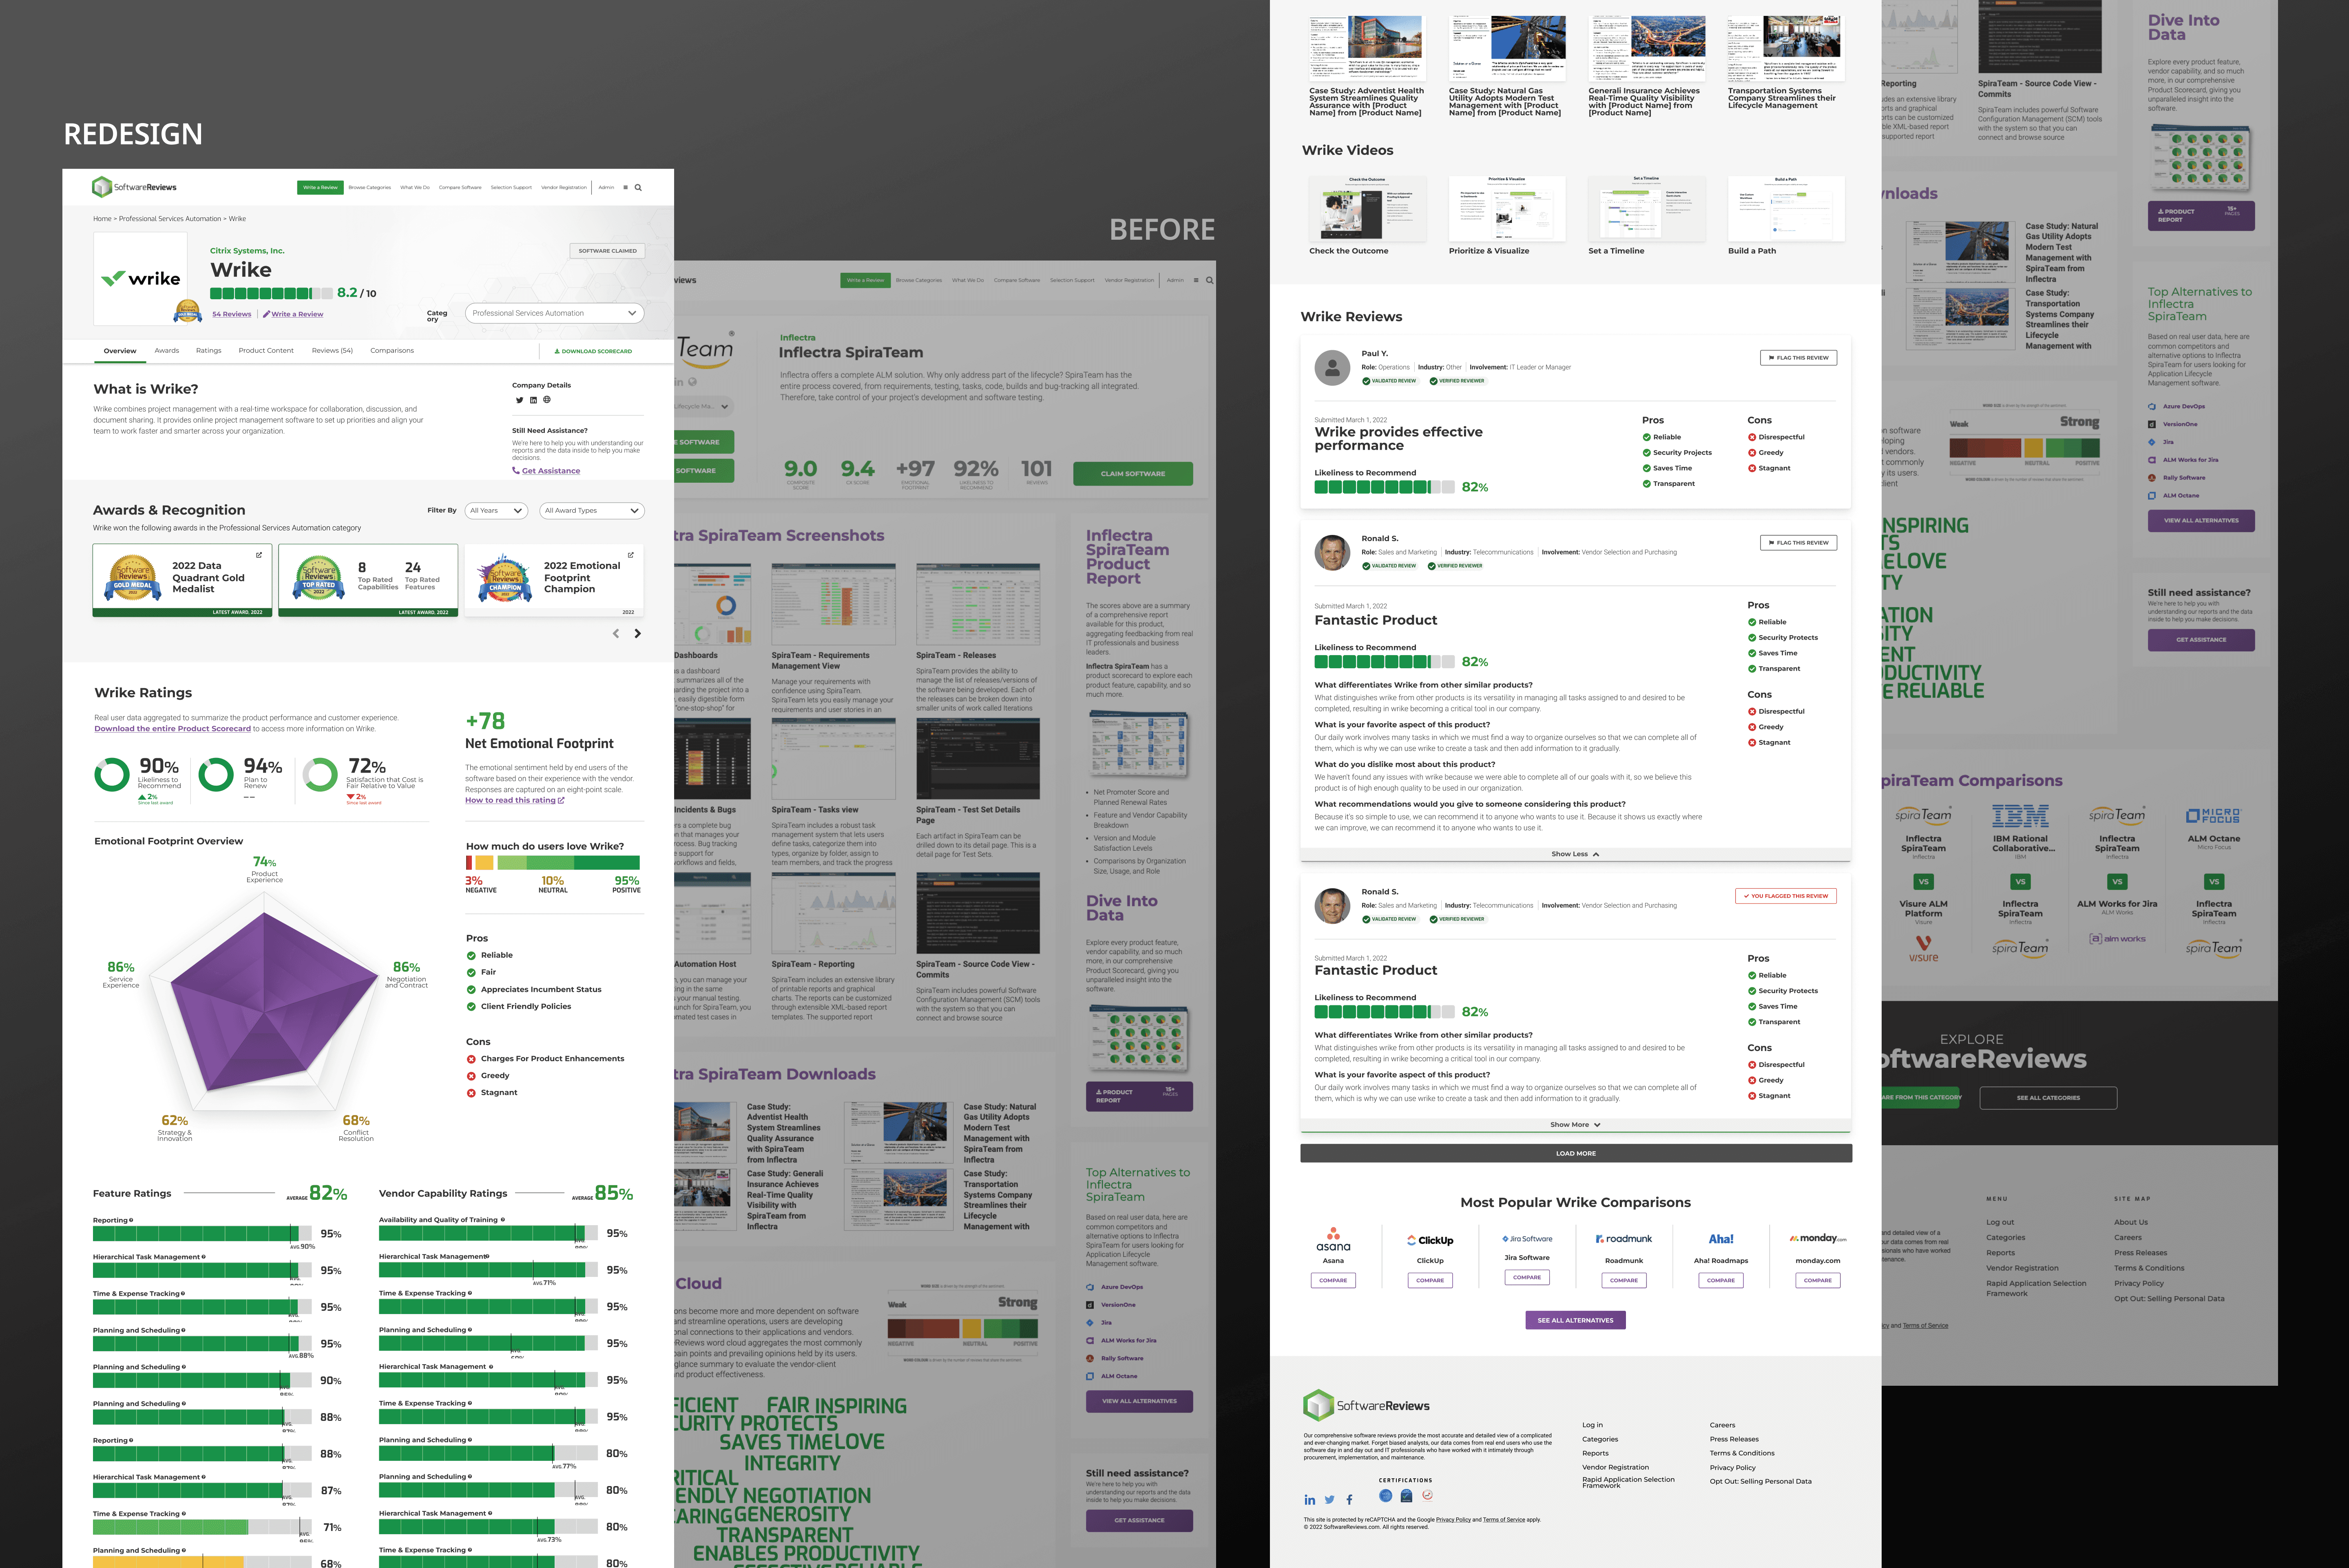
Design Phase: After approval, I designed high-fidelity pages for every scenario using SoftwareReviews brand guidelines, then carried design intent through handoff, QA and launch.

Key Decisions
DECISION 1
Reprioritize the information hierarchy of the page
What I chose: Moved the CTAs into their relevant sections and paired each one with its matching tier.
Tradeoff: Instead of showing every CTA in the header, I kept only one or two relevant buttons there. As a result, users are less likely to leave the page early by clicking a CTA.
DECISION 2
Remove the sidebar from the reading flow
What I chose: Research showed that only 20% of users read the sidebar content, and most of those who did left the page by clicking its links. So I moved the sub-tabs from the sidebar to the top of the page, just below the header, and redistributed the sidebar content into the relevant sections of the template page.
Tradeoff: Removing the sidebar means users can read the content from top to bottom without distractions.
DECISION 3
Implement the data visualization with existing Highcharts graphic
What I chose: Instead of building a new component, I used an existing Highcharts graphic and restyled it to match SoftwareReviews' visual style.
Tradeoff: Using Highcharts saved a lot of engineering effort, but we have less design flexibility because we're limited to what Highcharts supports.
Outcome
ENGAGEMENT & EXPOSION
more time spent on page with richer content.
vendors are using the new template.
with targeted keywords and content
Reflection
Mapping scenarios early was the most valuable thing I did. Designing for full, sparse, and empty data states before the high-fidelity phase helped the team spot opportunities and obstacles ahead of time.
Competing goals need an explicit priority order. UX research findings played a key role in backing up my recommended priority order.
What I'd do differently: I'd map out the user flow alongside the scenario mapping. That would give a clearer picture of how users actually experience the page.